

Over the last half-century, North America has lost a quarter of its bird population—3 billion birds, according to a 2019 study published in Science. This trend has implications not only for birds but for the entire biosphere, including humans. Determining the underlying causes of the decline in bird populations requires continent-wide collaboration. Located along a known migratory pathway for birds, Indiana is well-situated to contribute to a large-scale bird banding operation that can shed light on how birds are adapting to environmental change.
Collecting data to better understand climate change’s impact on birds
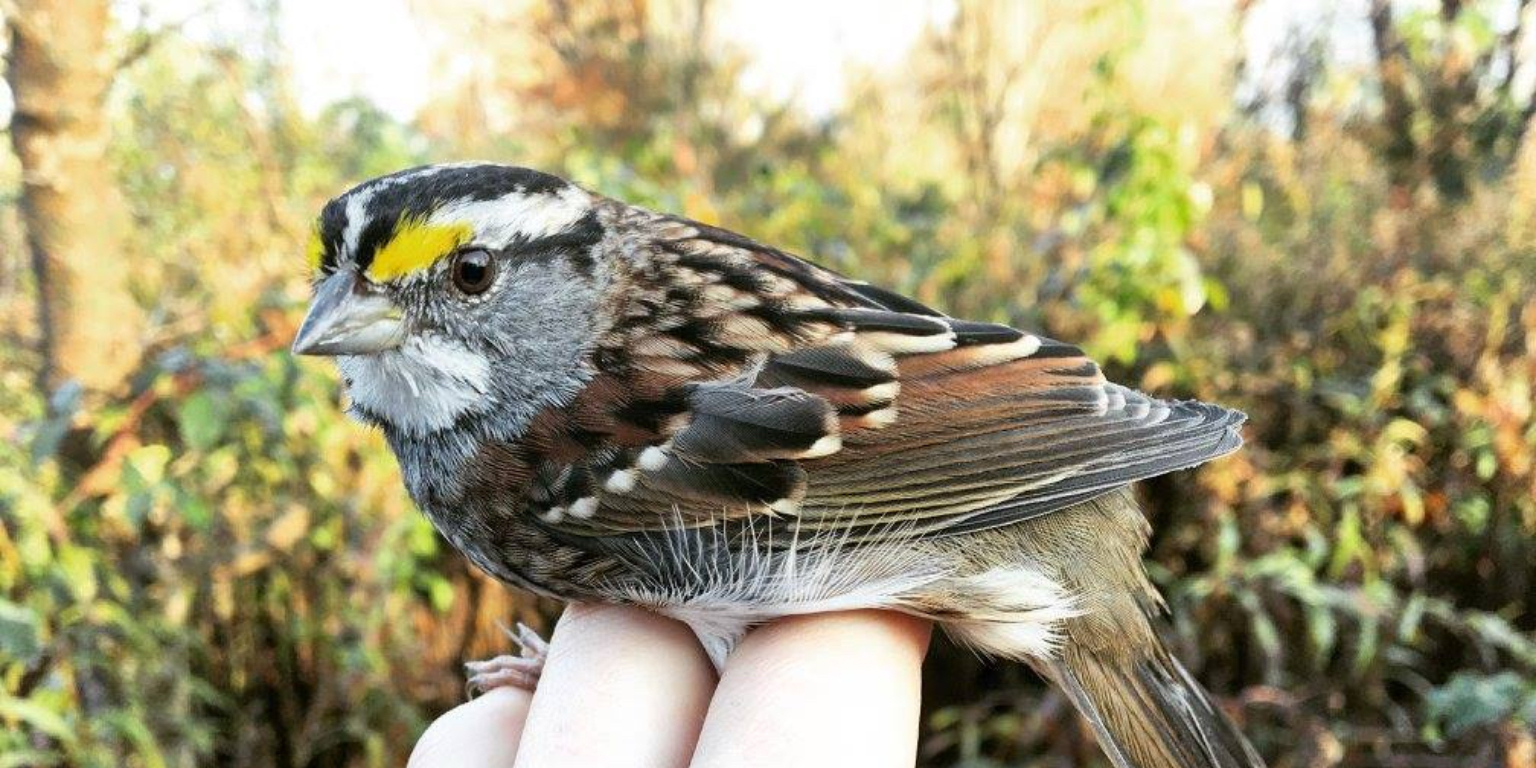
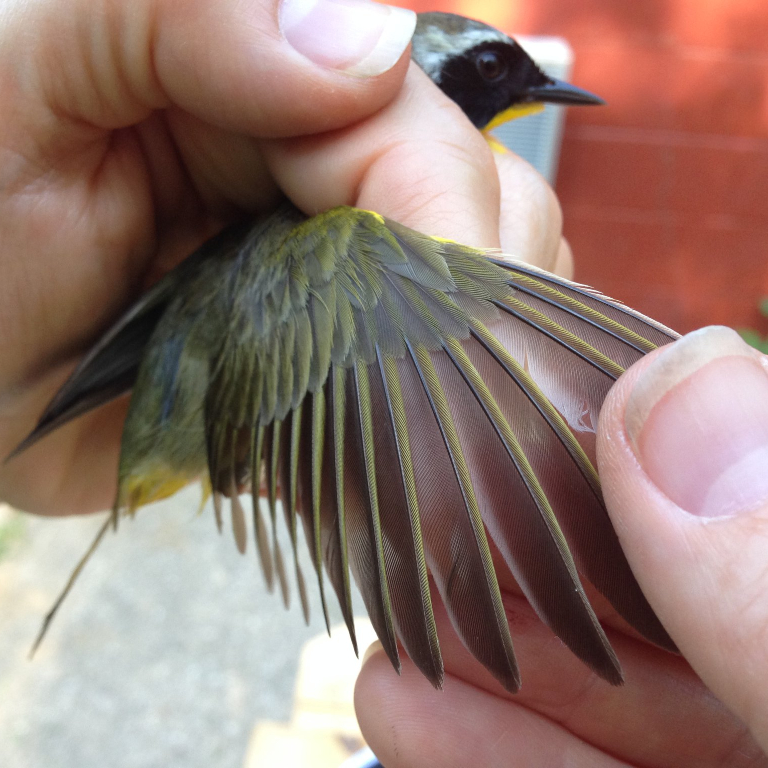
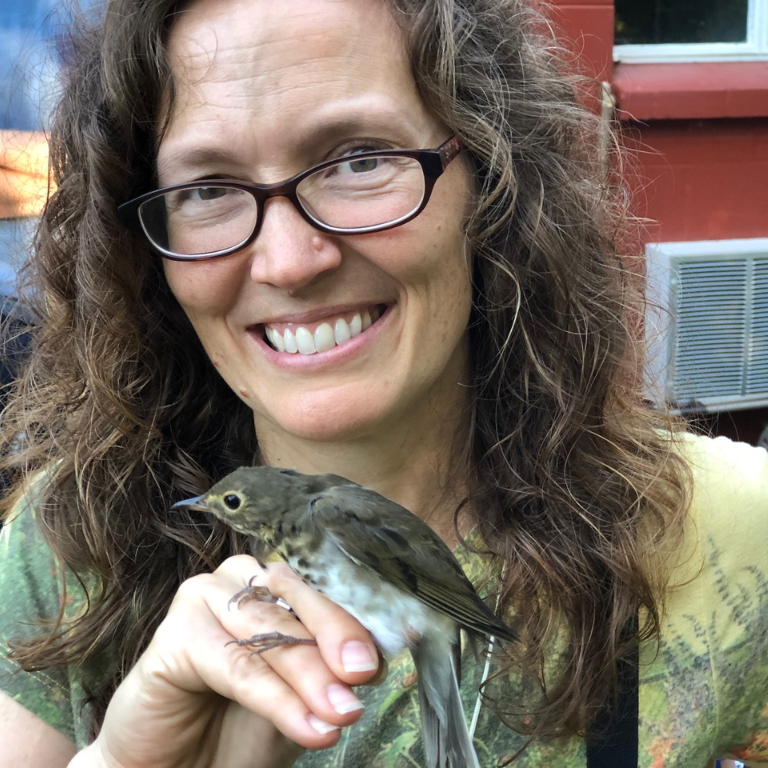
A White-throated Sparrow, a Common Yellowthroat, and Eve Cusack (who oversees the Kent Farm MAPS bird-banding station) holding a Swainson's Thrush. The station contributes valuable data on breeding birds and the environmental factors influencing their success.
Monitoring avian productivity and survival: National citizen-science bird banding
Researchers: Ellen Ketterson and Eve Cusack
Since 2017 the bird-banding station at Kent Farm has been a part of an international collaborative program called Monitoring Avian Productivity and Survivorship (MAPS) run by the Institute for Bird Populations (IBP). The MAPS program dates back three decades with over 1,200 stations spread across nearly every state, including more than 30 stations in Indiana. Each station follows a standardized collection protocol and adds its data to a database managed by IBP. Containing records for more than 2.5 million bird captures, the database is available to researchers to conduct large-scale studies on how environmental change is impacting bird populations over time.
The banding station is run primarily by volunteers who visit the site approximately every 10 days from May to August. Volunteers check the captured birds and record information on multiple variables before releasing the birds back into the wild. At the completion of the sixth season at Kent Farm in 2022, volunteers had captured and recorded 1,667 birds, including 1,200 unique individuals representing 46 species.
Project data
Researchers at the Kent Farm MAPS station net and band birds while taking standardized measurements. This data is then sent to a global database that can be accessed by researchers around the world.
The research team collects data for each bird that is captured to determine 26 key demographic data points on each bird—including breeding status, plumage, characteristics, age, and other measurements.
The research team goes to the station approximately every 10 days during the monitoring season (May-August). Team members set up 13 mist nets at sunrise that they check for birds once every 40 minutes for six hours. Each caught bird is placed in a cotton bag to transport back to the work area for assessment of the various data points. A bird with a band already on it—a recapture—will be recorded, while birds without bands will receive a band with a unique identification number issued by the Bird Banding Laboratory. The bird will then be released, and the data will be transmitted to IBP. Learn more about the methods from IBP.
The 26 standardized data points include sex characteristics, age, weight, wingspan, fat, juvenile characteristics, weight, band, and more.
The data is formatted in graphs, maps, tables, scatterplots, and matrices. Raw data in spreadsheets can also be accessed.
Researchers that wish to access MAPS data can reach out to IBP to collaborate, or they can download the data online.
As of early 2021, over 100 peer-reviewed papers and hundreds of reports on the vital rates of birds and their relationships to climate have been published. The findings from these studies have helped ensure conservation work is directed to the areas where it’s needed most.
The path forward
Many recent studies have applied MAPS data to better understand climate change’s impact on birds. As more data is recorded, future studies could contribute to solutions on how to conserve birds and their habitat.
In addition to maintaining its bird-banding operation, MCB welcomes visitors to Kent Farm to teach others about the services birds provide and the role they play in maintaining a healthy ecosystem.